The Debugger
- Manage
 Copy
Copy- Actions
 Export
 Print preview
 View Source
- Viewers
 Siblings
 Comments
- Annotations
 Attachments (10)
 History
 Information
The Requea platform embeds a step by step debugger (the new debugger) to analyze problems in JavaScript or operations and user actions flow.
The debugger is available on platforms:
2.2.653 and above
3.0.76 and above
Note that previous platforms use the previous version of the debugger which is no more supported.
Access to the debugger
The debugger is available if your are logged as RequeaDev (sysDesignExpert). The "debug" link appears on the top right of the screen:
Setting up breakpoints
When you view a script (in an operation step for example), you can setup or remove breakpoints by clicking on the gutter on the left of the screen:
(not available during script edit)

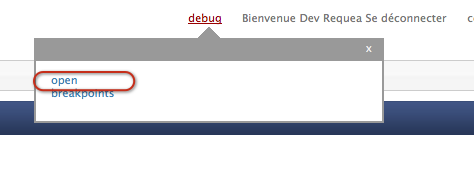
You can list your breakpoints by clicking the "breakpoints" link in the debugger section
Start debugging
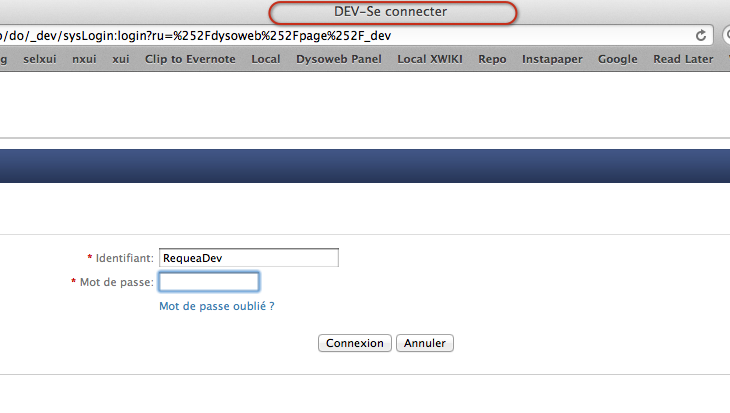
To start a debugging section, click on the "open" link. This will bring a browser window where you can log with a user name (it may be different than the RequeaDev that you have on the main window).
Note the "DEV" in the title of the window to distinguish with the main (the debugger) window.
Note that if you log gout in the main window, both users will be disconnected.
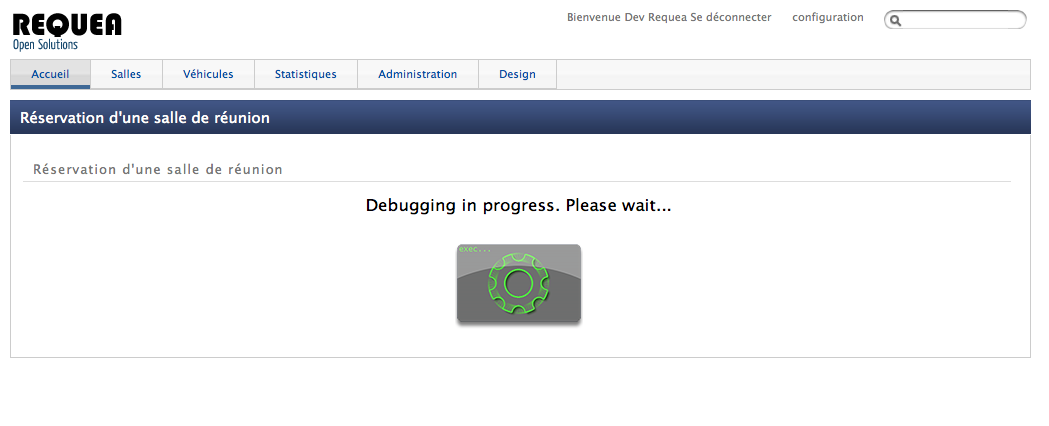
Start using the functionality where you have setup a breakpoint (to get your operation script called for example). When the platform encounters a breakpoint, it will be suspended:
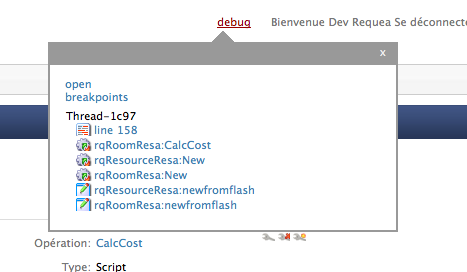
 Go back to the main window, and with your mouse, roll over the "debug" link. You will see the suspended thread with the corresponding stack (script code, operations and user actions).
You can click on the script to see the line in the corresponding script
Step by step debugging
The debugger has a floating control panel on the right of the screen:
You can:
- "continue" (F8) to go o the new breakpoint (or the next step that requires user input like a form)
- "step into" (F11) will drill into the code
- "step over" (F10) will get over an interaction
- "step return" (F7) will get back to one level in the stack
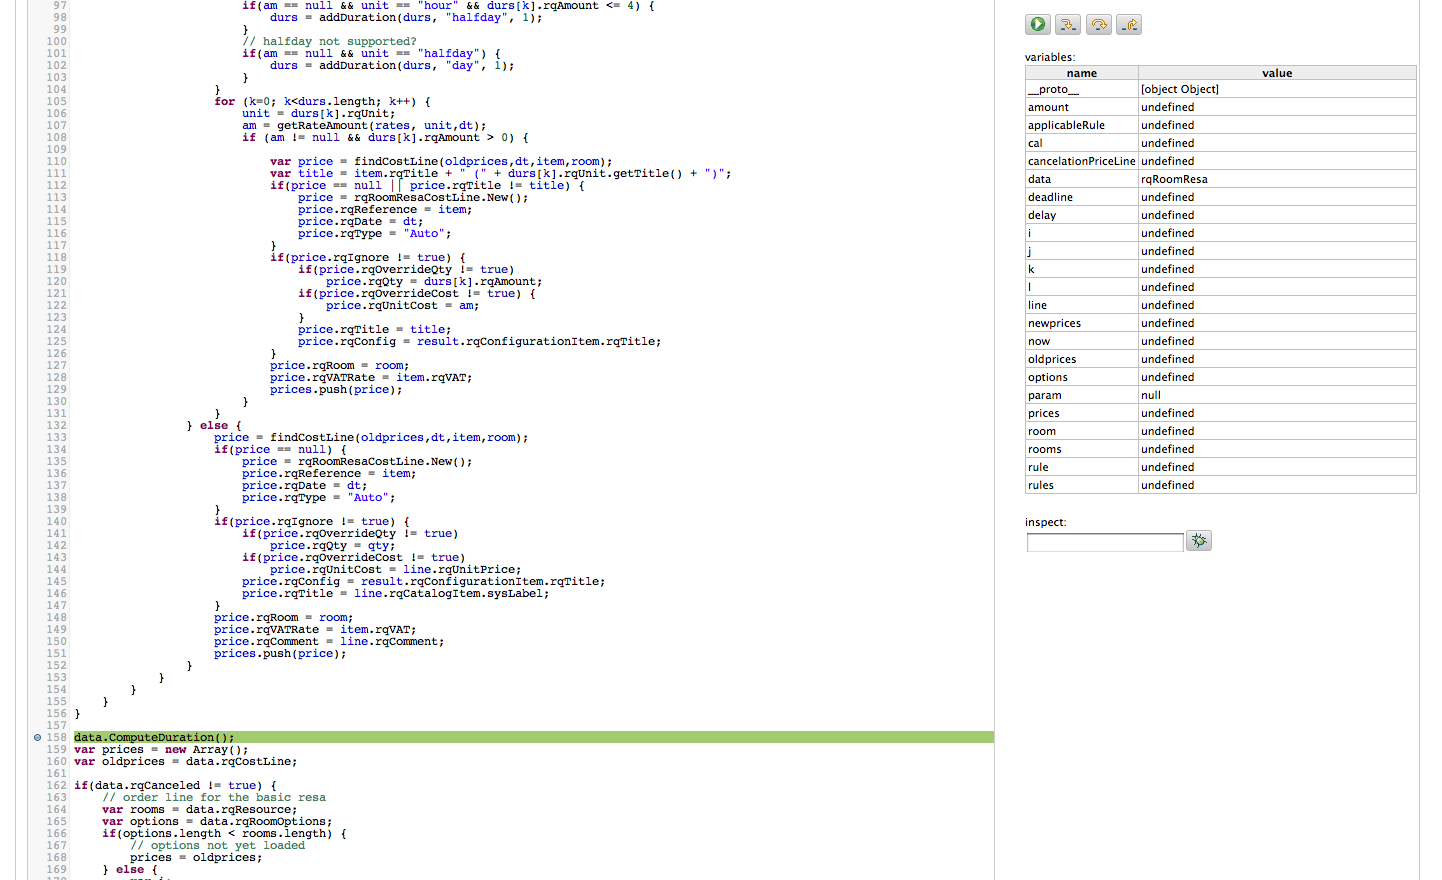
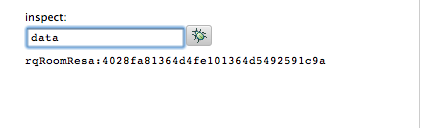
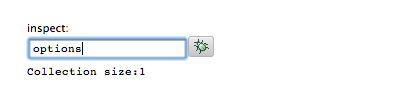
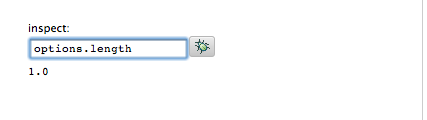
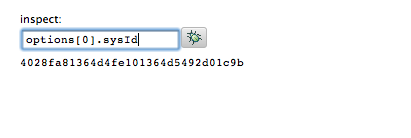
Local variables and inspecting variables
Bellow the control panel you have an updated list of local variables and their value.
You may also inspect variables in the inspector field.
Note:
For collections (arrays), use the .length and the bracket ([0]) notation to inspect array items: